What is Computer Vision?
Teaching Machines to See
In 1966 Seymour Papert at MIT assigned a summer project to a handful of students: connect a camera to a computer and have it describe what it saw. It was meant to take one summer.
That summer never really ended. Catching a thrown ball, recognising your mother's face across a crowded room, reading a stop sign through rain on a windshield: every one of these is, for a human, effortless and instant. For a machine, each is a research career.
A computer does not see a scene. It sees a grid of numbers, and the entire field of computer vision is the art of pulling meaning back out.
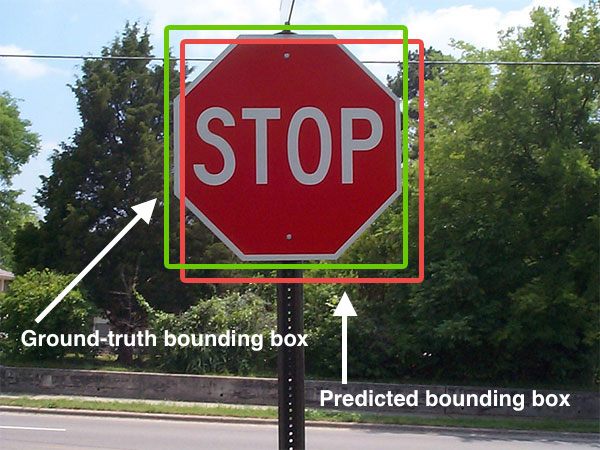
Here is the uncomfortable truth at the heart of it all. When a camera captures a stop sign, the computer does not receive "a red octagon." It receives a few million integers between 0 and 255, arranged in a rectangle. Computer vision is the discipline of turning that wall of numbers into descriptions a thinking process can act on: this is a sign, it says STOP, it is twelve metres ahead. The numbers are the easy part. The meaning is everything.
Do this: tap Camera (or upload a photo) and point it at something with sharp structure: a window frame, a checkerboard, the corner of a book. Look for the bright dots the right pane sprinkles onto the scene. Now slowly rotate or tilt the view. Notice that the dots cling to the same physical corners even as everything moves.
What you just watched is the first leap from numbers to meaning. The detector never knew "book" or "window." It scanned the grid of pixels for places where brightness changes sharply in two directions at once, the mathematical signature of a corner, and marked them. Those marked points are features: small, repeatable, computable anchors. Almost every higher trick in this course (matching two photos, reconstructing 3D, tracking an object across frames) is built on features like these. We turned a flat sea of intensities into a sparse set of things worth paying attention to.
A picture is a function of numbers
Strip away the romance and an image is a function. A grayscale picture assigns one brightness value to each location:
Reading that aloud: is the image, a rule that takes a horizontal coordinate and a vertical coordinate and hands back a single number, the brightness at that spot. The square brackets mean the value lives between (pure black) and (pure white). A colour image is just three such functions stacked, one for red, one for green, one for blue, written .
That single line is why seeing is hard. The function has no idea what it depicts. There is no "cat" stored anywhere in it, only the brightness of light that happened to land on a sensor. Every algorithm in this book is, deep down, a clever way of asking questions of : where does it change fastest? where does it repeat? which patches of it move together between two frames?
From pixels to a pipeline
Most vision systems, classical or modern, march through the same broad stages. The names change, the shape rarely does.
- Acquisition. A lens focuses light onto a sensor; the sensor quantises it into the grid .
- Pre-processing. Tame the raw signal: reduce sensor noise, correct exposure, normalise contrast so later steps are not fooled by lighting.
- Feature extraction. Find the edges, corners, blobs, and textures that carry information, exactly what the sim above just did.
- Analysis. Group features into structure: this cluster is an object, those lines form a lane, that region is skin.
- Decision. Emit something the world can use: a label, a bounding box, a steering angle, an alarm.
Two cultures: computer vision and machine vision
The lab and the factory floor want different things from the same idea. Computer vision is the science: extract general descriptions of the world from images, robust to whatever the world throws at you. Machine vision is the engineering cousin: a controlled camera, controlled lighting, one job done fast and reliably, again and again, on an assembly line.
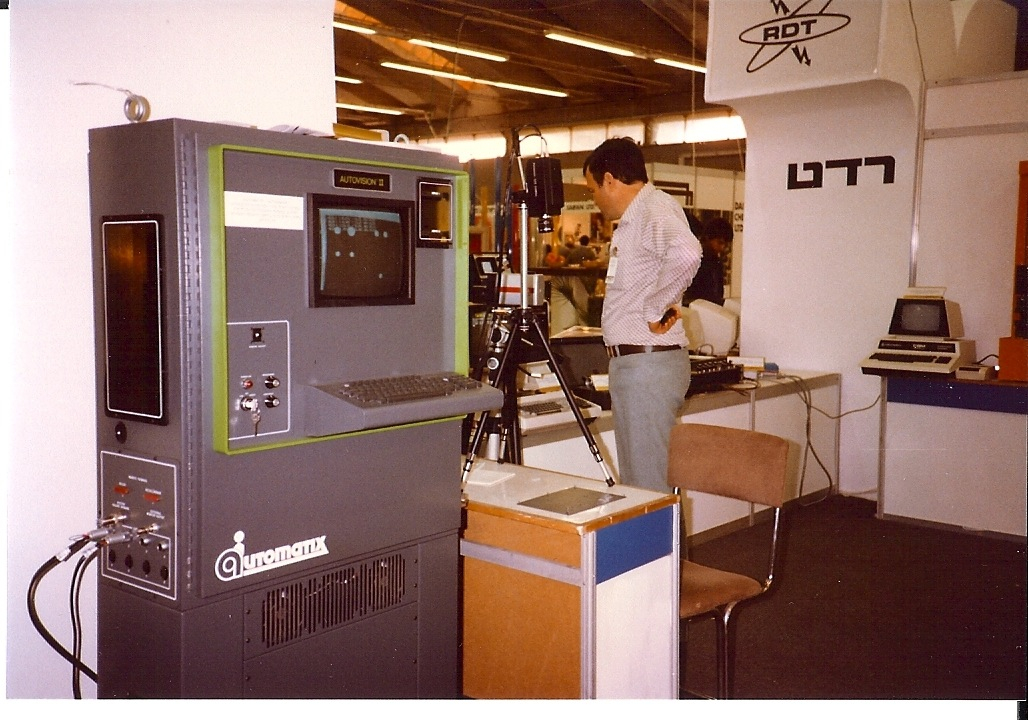
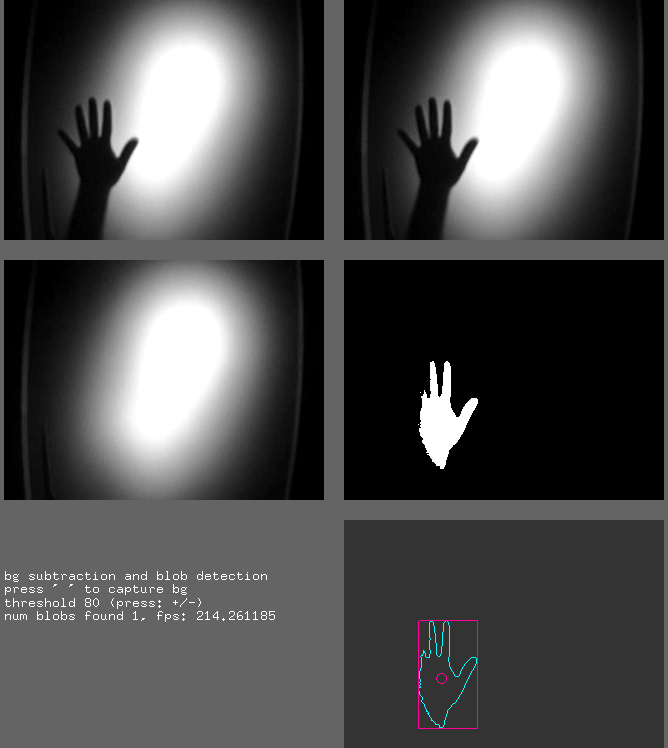
Both lean on the same toolbox. The hand-detection demo below is pure machine-vision spirit: a backlit silhouette, a brightness threshold, and a blob detector that reports a single object with its outline and centre. It is the 1983 light table reborn in software.
Features: the idea that ties it together
Look again at the writing desk below. On the left, a perfectly ordinary photograph. On the right, the same photo with hundreds of small markers dropped onto it by a corner detector.
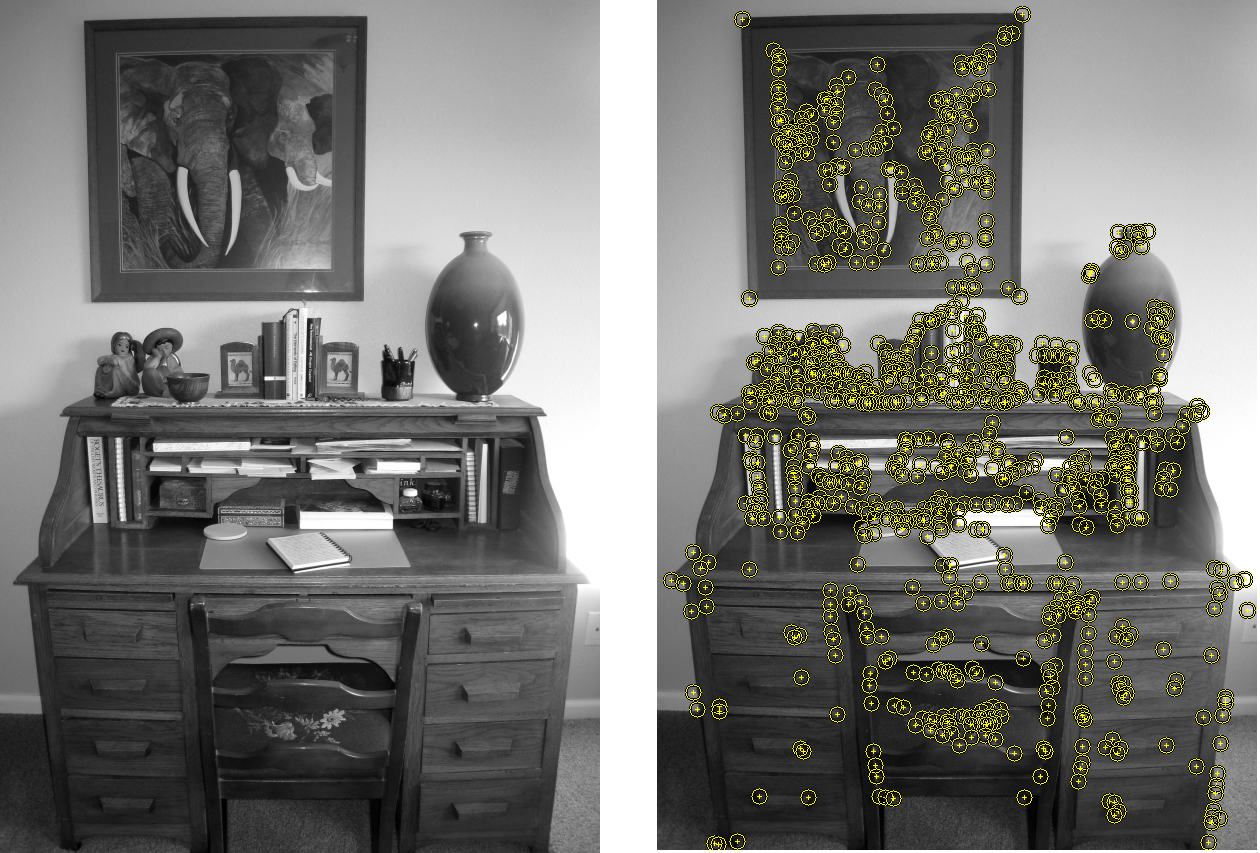
A feature is any piece of an image worth singling out: a corner, an edge, a blob, a patch of distinctive texture. The reason features matter so much is repeatability. Photograph the desk from a slightly different angle, and a good detector lands on nearly the same physical corners. That stability is what lets a self-driving car know it is looking at the same lane line two frames later, or lets a phone stitch a panorama from overlapping shots. We will spend whole chapters of this course on better and better feature detectors, but the desk above is the whole idea in one image: find the few points that survive being looked at differently.
why a corner is mathematically special
A corner is where image brightness changes in every direction you push. Slide a small window around a point and measure how much the patch underneath changes; this is captured by the second-moment matrix, built from the image gradients and :
Here and are how fast brightness changes left-right and up-down, is a weighting window, and the sum runs over a small patch . The two eigenvalues of tell the whole story: both small means a flat region (nothing happening), one large means an edge (change in one direction only), both large means a corner (change in two directions). Rather than compute eigenvalues directly, the Harris detector uses a cheap proxy:
A large positive flags a corner, with a small constant (typically to ). The bright dots in the sim and the yellow markers on the writing desk are exactly the pixels where crosses a threshold. We derive this from scratch in the corner-detection chapter; for now, the takeaway is that "interesting" can be made into arithmetic.
Key takeaways
- An image is just numbers. Formally a function returning brightness per location, with no built-in notion of objects or meaning.
- Computer vision is the art of recovering meaning from that grid, where seeing turns out to be far harder than the 1966 MIT summer project assumed.
- Most systems follow one pipeline: acquire, pre-process, extract features, analyse, decide.
- Features are the bridge. Corners, edges, and blobs are repeatable anchors that survive changes in viewpoint, and nearly every later technique stands on them.
- Computer vision and machine vision share a toolbox but differ in spirit: open-world robustness versus controlled, repeatable industrial speed, both served by libraries like OpenCV.
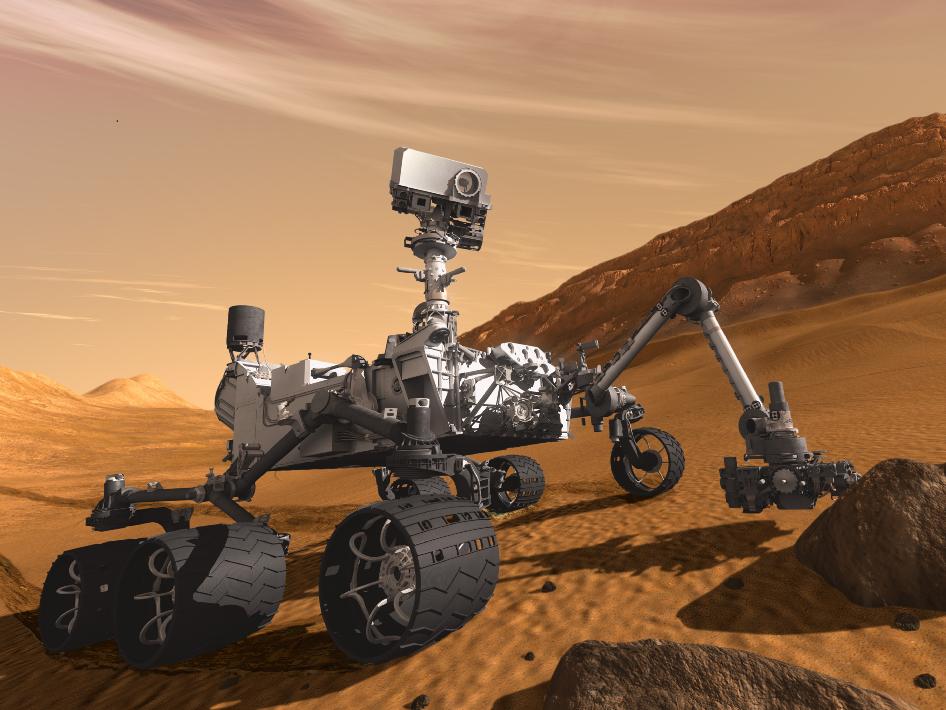
Papert's students thought a single summer would be enough to teach a machine to look. Sixty years later, a rover on Mars steers itself across a dead red plain, a phone unlocks at a glance, and a car reads a stop sign through the rain, all of them quietly performing the impossible homework.
And underneath every one of them is the same humble move you made a moment ago, pointing a camera at a corner and watching a dot appear. A grid of numbers, and the long, beautiful labour of pulling meaning back out.